BOSTON HARBOR SEA LEVEL RISE MAPS
Drs. Paul Kirshen and Ellen Douglas and Mr. Chris Watson developed these maps in 2010 to show the impact of 2.5 feet, 5 feet and 7.5 feet of flooding above mean high tide on the Boston Harbor coastline. As they explained in their presentation, this flooding can occur through one or more of three main reasons: 1) sea level rise, 2) astronomical high tides (when the moon and the sun align) and 3) storm surges.
Climate change is already increasing the likelihood of coastal and riparian (river) flooding due to sea level rise and extreme weather events. Astronomical high tides occur four to six times every year. As the impacts of climate change are increasingly felt, we can expect coastal flooding events to become more frequent and more severe, even during this century.
Methodology
To Download Maps
These maps are free for public use; please credit The Boston Harbor Association. To download high-resolution versions, click once on the image of the map to pull up a larger version. Right click on the larger map and select “Save As.” If you right click on the smaller version of the map, you will only download a low-resolution image.
Study Area Maps
- 1890’s
- Plus 2.5 feet of flooding from all sources
- Plus 5.0 feet of flooding from all sources
- Plus 7.5 feet of flooding from all sources
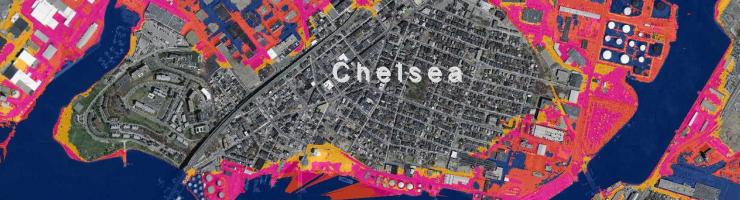
East Boston, Everett and Chelsea Maps
- 1890’s
- Plus 2.5 feet of flooding from all sources
- Plus 5.0 feet of flooding from all sources
- Plus 7.5 feet of flooding from all sources
Inner Harbor Maps
- 1890’s
- Plus 2.5 feet of flooding from all sources
- Plus 5.0 feet of flooding from all sources
- Plus 7.5 feet of flooding from all sources
Dorchester and Quincy Maps
- 1890’s
- Plus 2.5 feet of flooding from all sources
- Plus 5.0 feet of flooding from all sources
- Plus 7.5 feet of flooding from all sources